Downside Tasuki Gap Explained: Strategy, Meaning, and Limitations
Candlestick patterns are powerful tools in technical analysis, helping traders identify potential market trends and reversals. Among these patterns, the downside tasuki gap is a lesser-known yet important continuation pattern that can provide valuable insights into bearish market momentum.
In this blog, we will cover the downside tasuki gap meaning , how it works, the downside tasuki gap strategy , and the key downside tasuki gap limitations every trader should know.
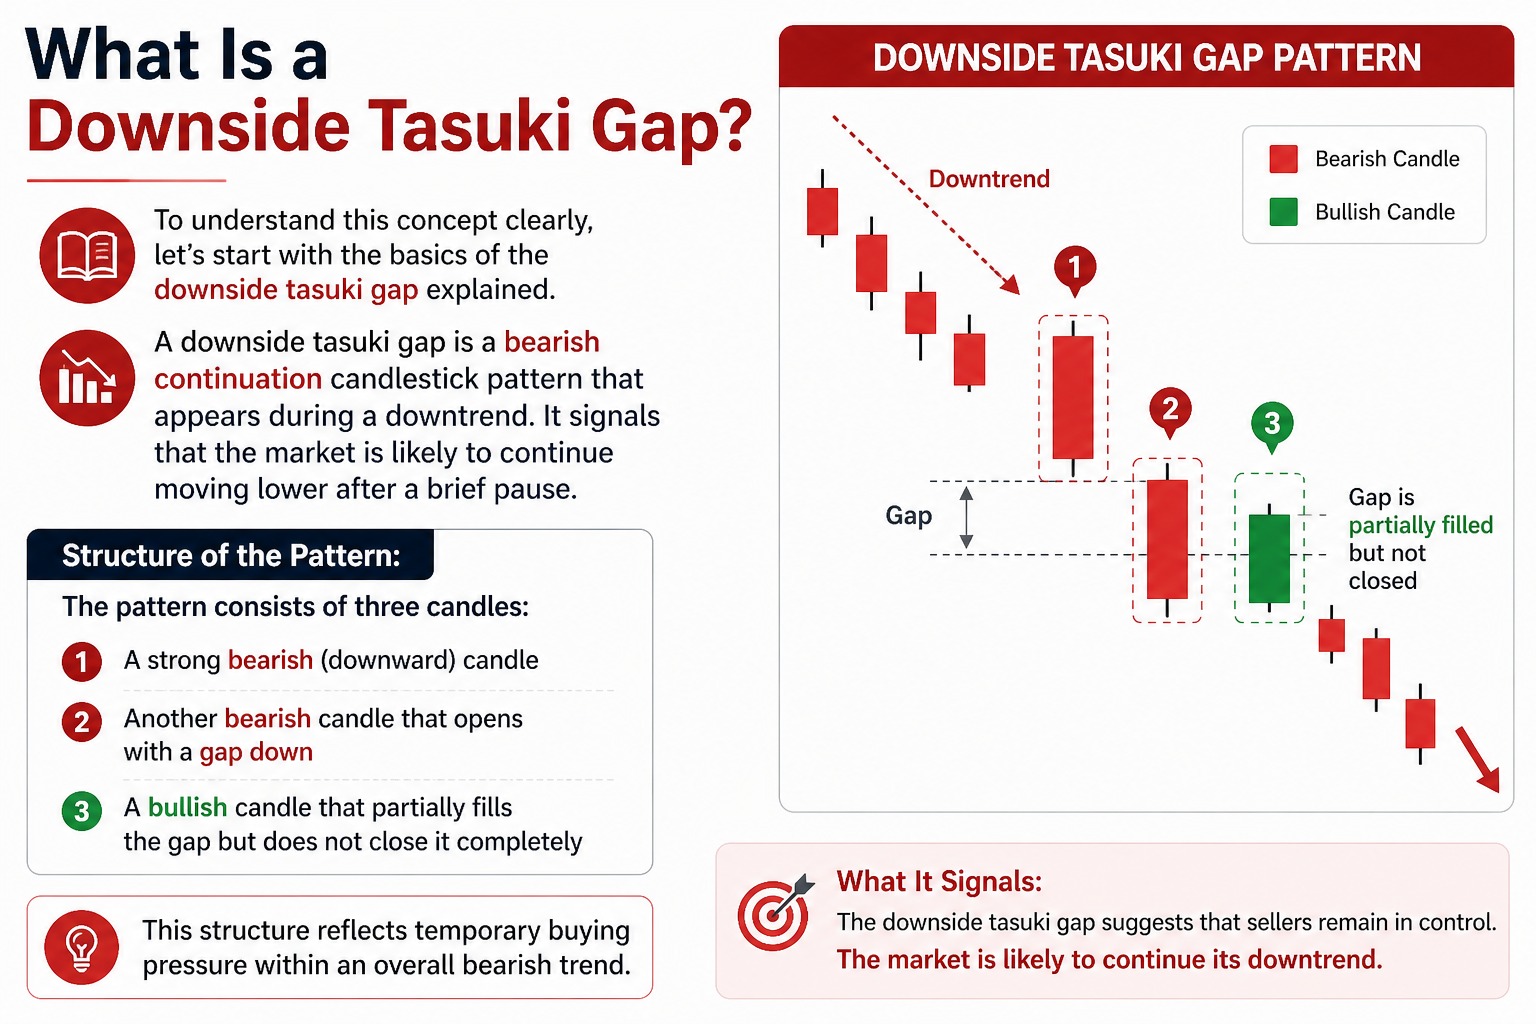
What Is a Downside Tasuki Gap?
To understand this concept clearly, let’s start with the basics of the downside tasuki gap explained.
A downside tasuki gap is a bearish continuation candlestick pattern that appears during a downtrend. It signals that the market is likely to continue moving lower after a brief pause.
Structure of the Pattern:
The pattern consists of three candles:
A strong bearish (downward) candle
Another bearish candle that opens with a gap down
A bullish candle that partially fills the gap but does not close it completely
This structure reflects temporary buying pressure within an overall bearish trend.
Downside Tasuki Gap in Stock Market
The downside tasuki gap in the stock market is typically seen in trending markets, especially during strong bearish phases.
When Does It Occur?
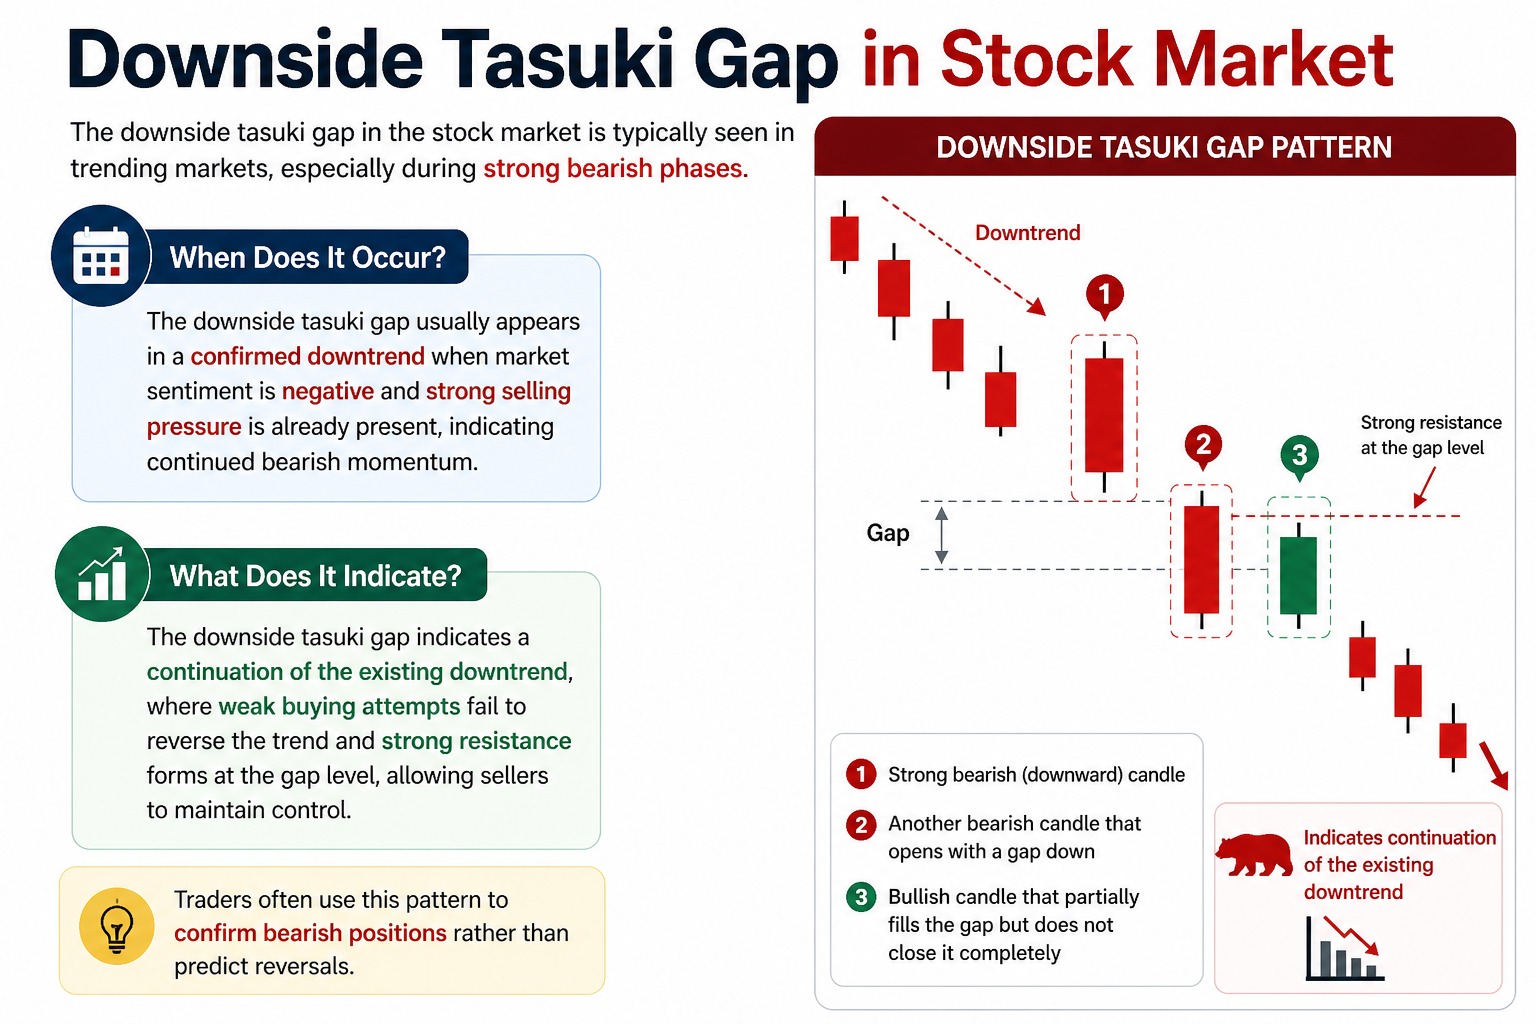
The downside tasuki gap usually appears in a confirmed downtrend when market sentiment is negative and strong selling pressure is already present, indicating continued bearish momentum.
What Does It Indicate?
The downside tasuki gap indicates a continuation of the existing downtrend, where weak buying attempts fail to reverse the trend and strong resistance forms at the gap level, allowing sellers to maintain control.
Traders often use this pattern to confirm bearish positions rather than predict reversals.
How to Identify a Downside Tasuki Gap ?
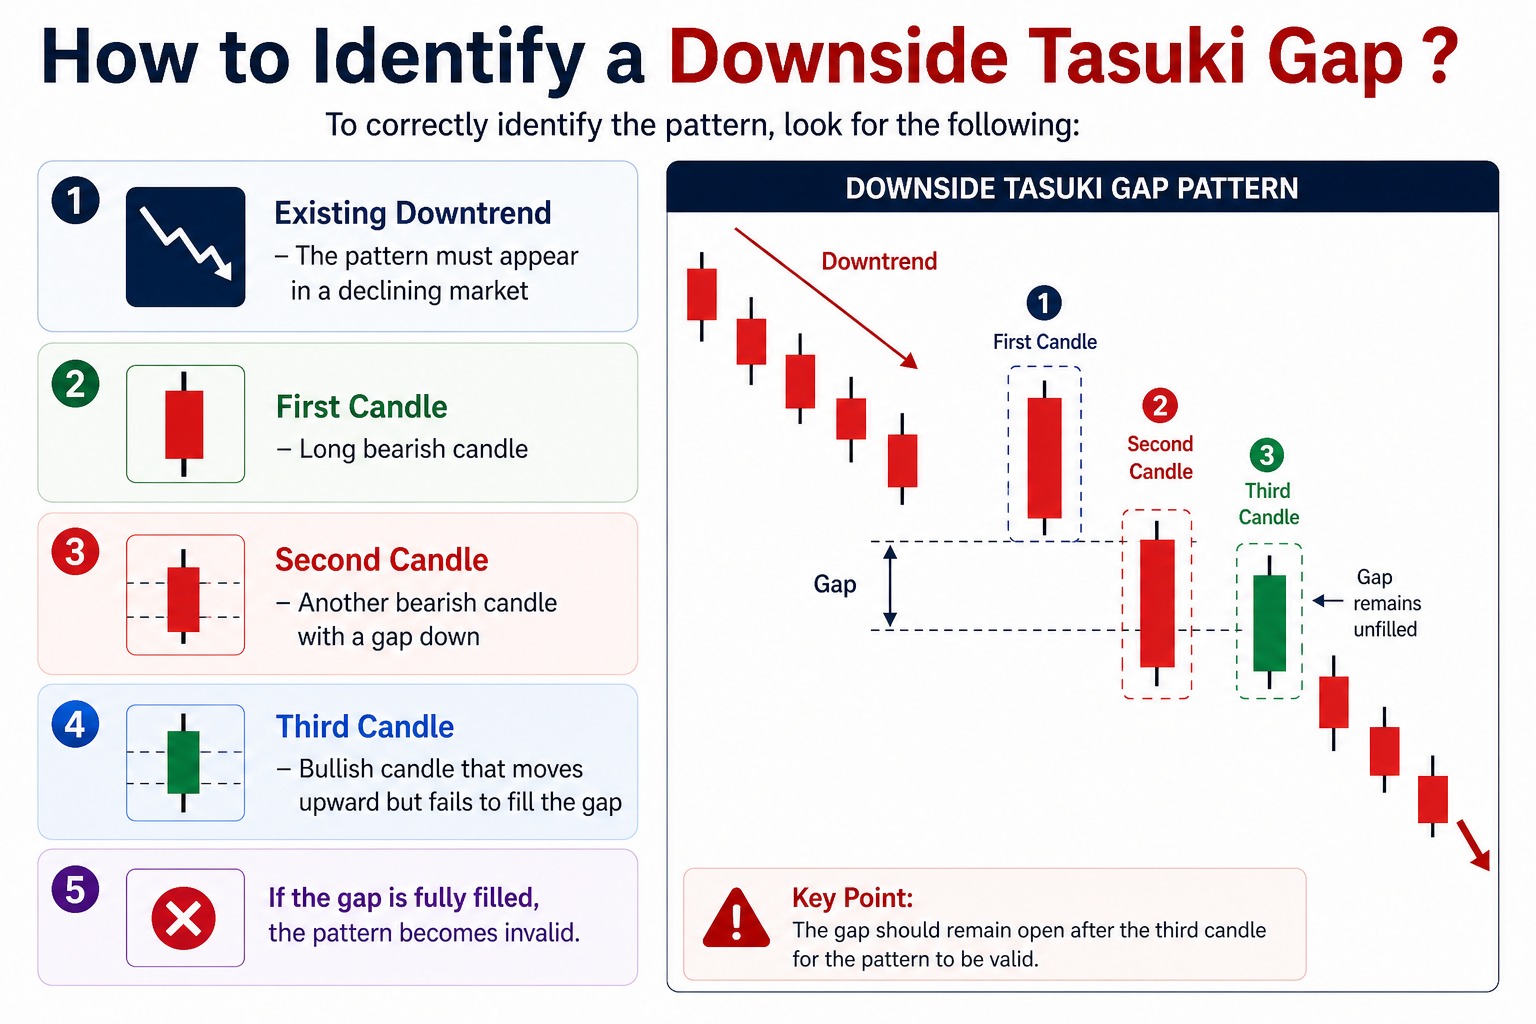
To correctly identify the pattern, look for the following:
Existing Downtrend – The pattern must appear in a declining market
First Candle – Long bearish candle
Second Candle – Another bearish candle with a gap down
Third Candle – Bullish candle that moves upward but fails to fill the gap
If the gap is fully filled, the pattern becomes invalid.
Downside Tasuki Gap Strategy
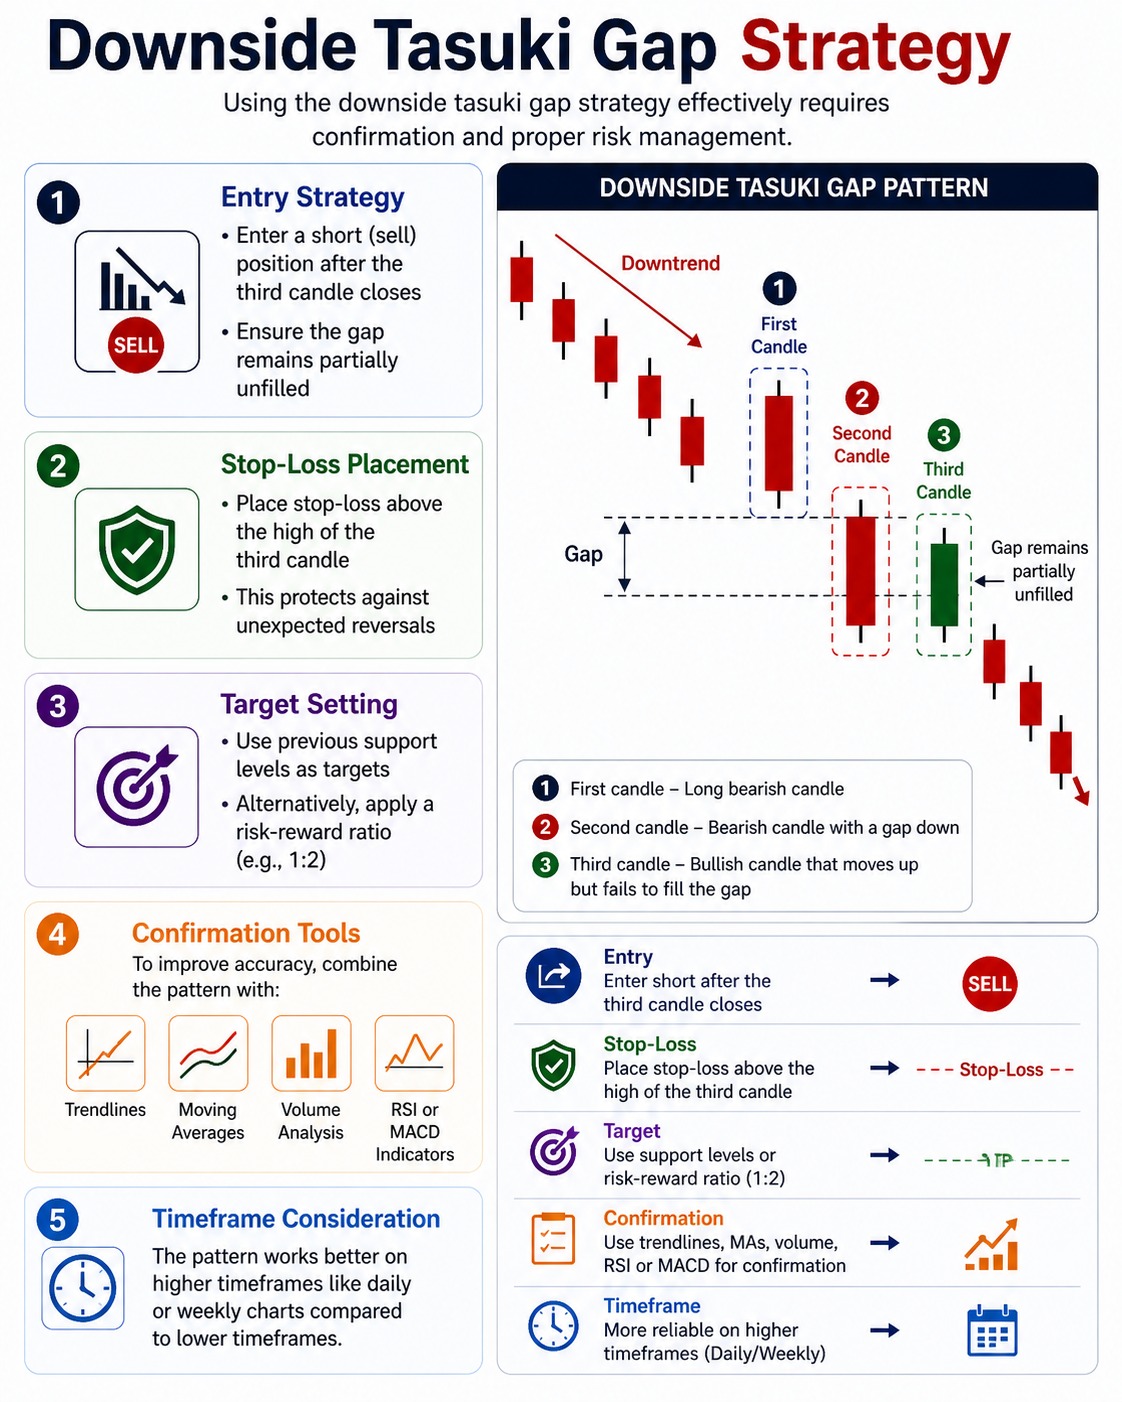
Using the downside tasuki gap strategy effectively requires confirmation and proper risk management.
1. Entry Strategy
Enter a short (sell) position after the third candle closes
Ensure the gap remains partially unfilled
2. Stop-Loss Placement
Place stop-loss above the high of the third candle
This protects against unexpected reversals
3. Target Setting
Use previous support levels as targets
Alternatively, apply a risk-reward ratio (e.g., 1:2)
4. Confirmation Tools
To improve accuracy, combine the pattern with:
Trendlines, Moving averages, Volume analysis, RSI or MACD indicators
5. Timeframe Consideration
The pattern works better on higher timeframes like daily or weekly charts compared to lower timeframes.
Example of Downside Tasuki Gap
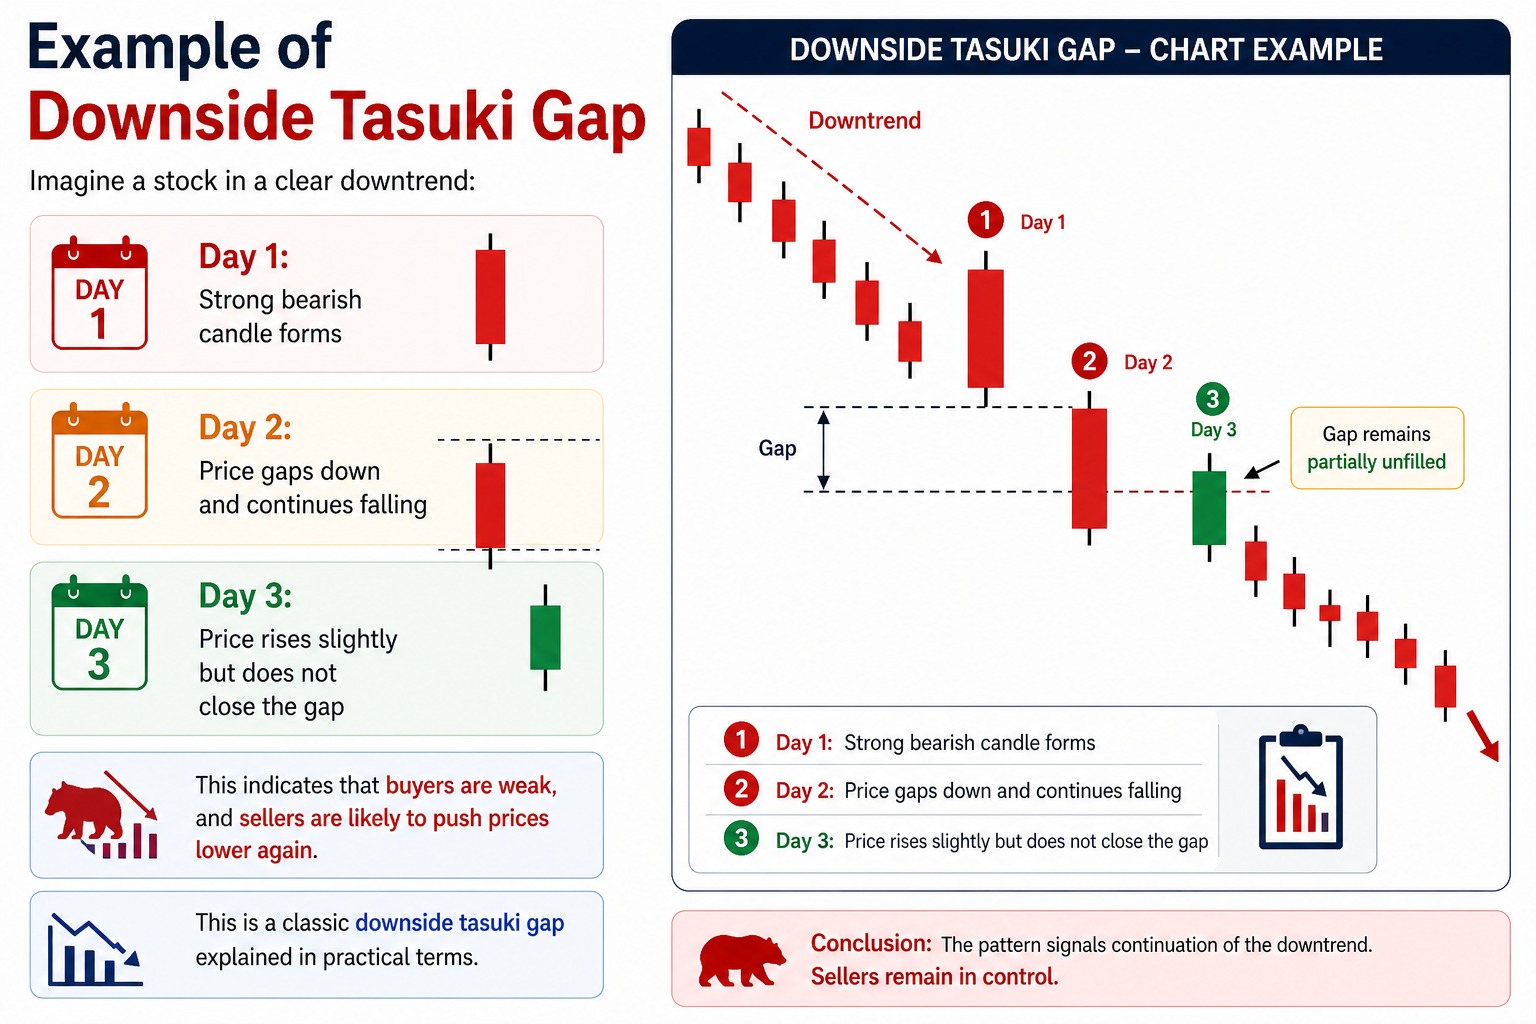
Imagine a stock in a clear downtrend:
Day 1: Strong bearish candle forms
Day 2: Price gaps down and continues falling
Day 3: Price rises slightly but does not close the gap
This indicates that buyers are weak, and sellers are likely to push prices lower again.
This is a classic downside tasuki gap explained in practical terms.
Benefits of Using Downside Tasuki Gap
While not very common, this pattern offers some advantages:
1. Clear Trend Continuation Signal
It confirms bearish momentum in an ongoing trend.
2. Defined Risk Levels
The structure makes it easier to set stop-loss points.
3. Works Well with Other Indicators
It can be combined with technical tools for stronger confirmation.
4. Helps Avoid False Reversals
Traders can avoid mistaking temporary pullbacks for trend reversals.
Downside Tasuki Gap Limitations
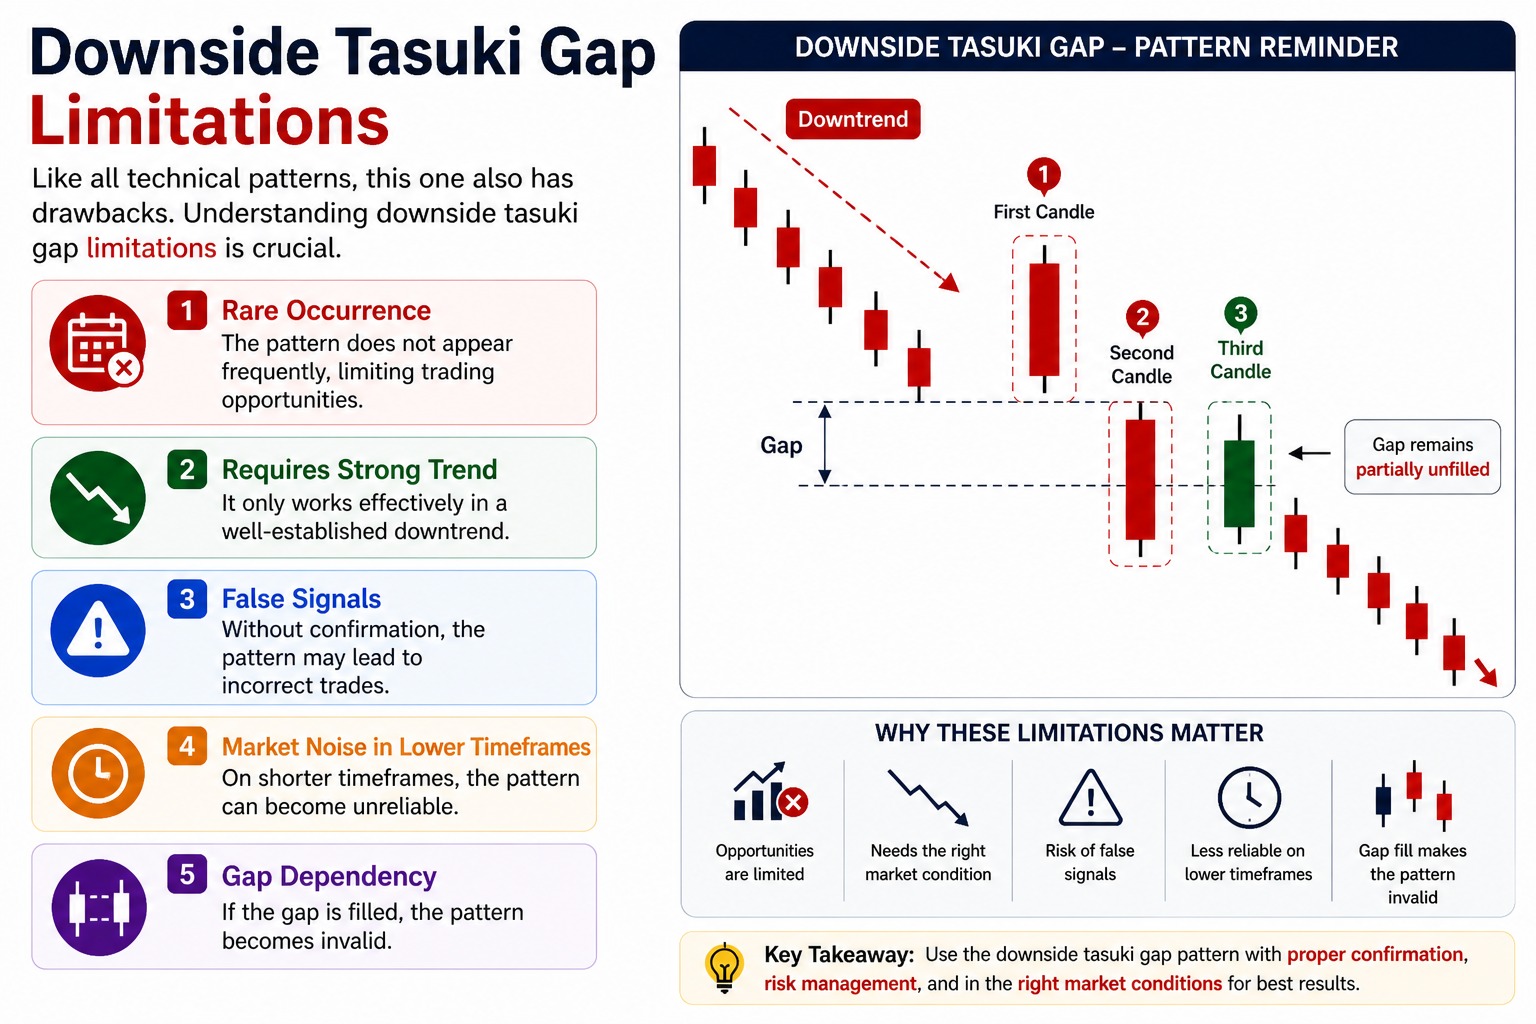
Like all technical patterns, this one also has drawbacks. Understanding downside tasuki gap limitations is crucial.
1. Rare Occurrence
The pattern does not appear frequently, limiting trading opportunities.
2. Requires Strong Trend
It only works effectively in a well-established downtrend.
3. False Signals
Without confirmation, the pattern may lead to incorrect trades.
4. Market Noise in Lower Timeframes
On shorter timeframes, the pattern can become unreliable.
5. Gap Dependency
If the gap is filled, the pattern becomes invalid.
Downside vs Upside Tasuki Gap
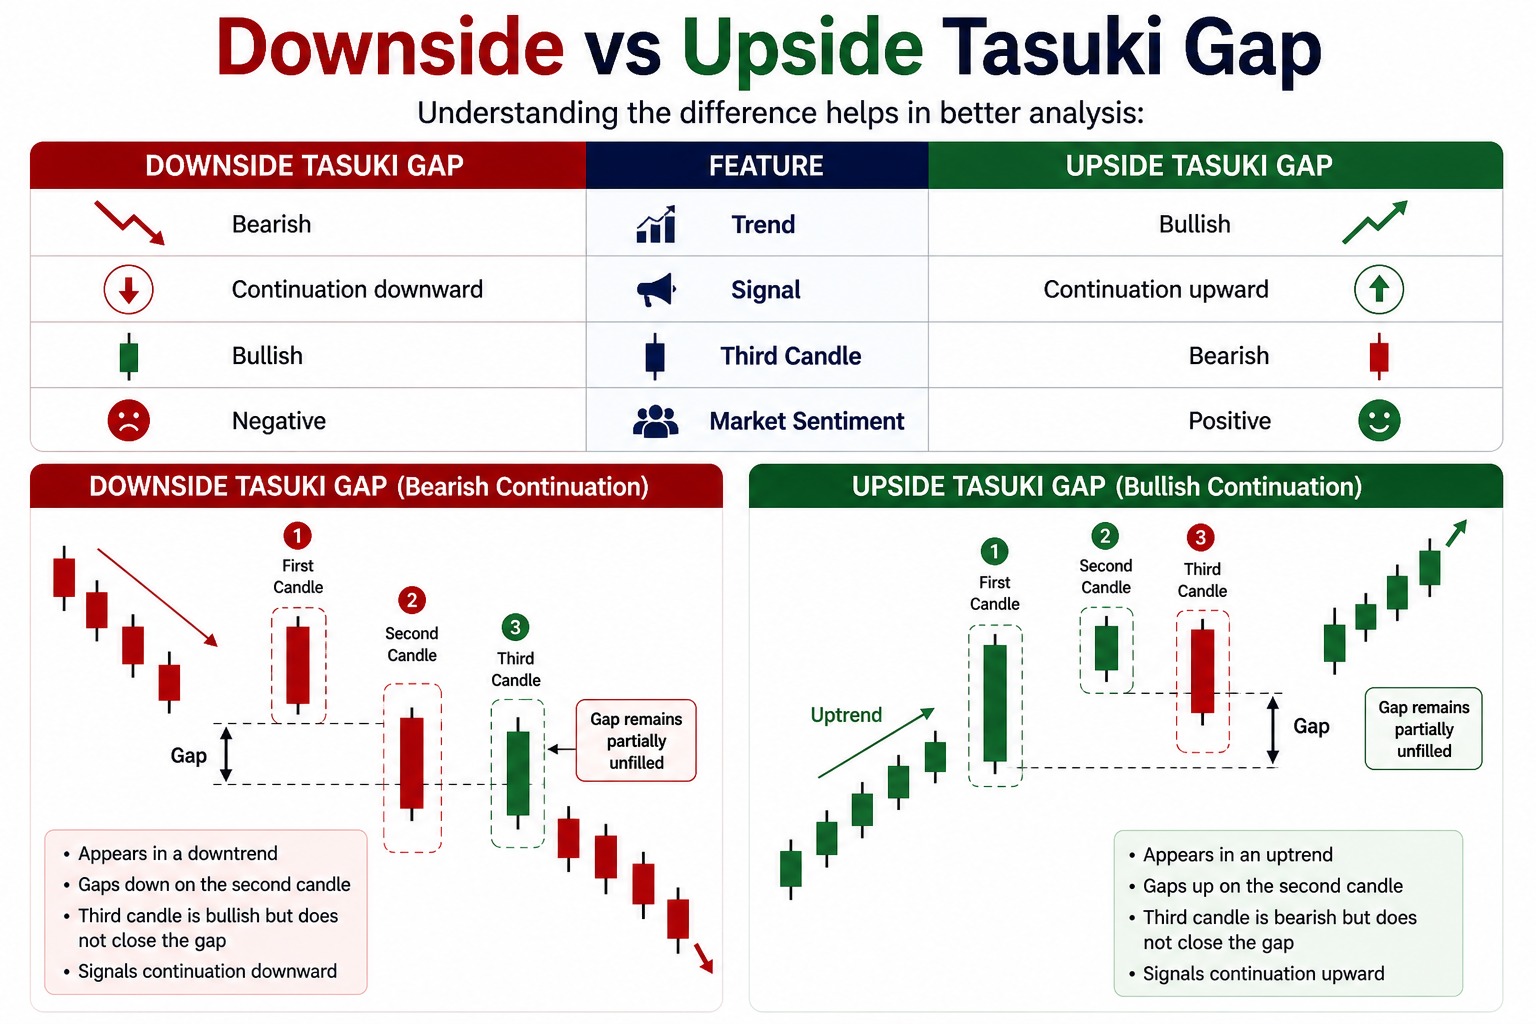
Understanding the difference helps in better analysis:
| Feature | Downside Tasuki Gap | Upside Tasuki Gap |
|---|---|---|
| Trend | Bearish | Bullish |
| Signal | Continuation downward | Continuation upward |
| Third Candle | Bullish | Bearish |
| Market Sentiment | Negative | Positive |
Tips for Trading the Downside Tasuki Gap
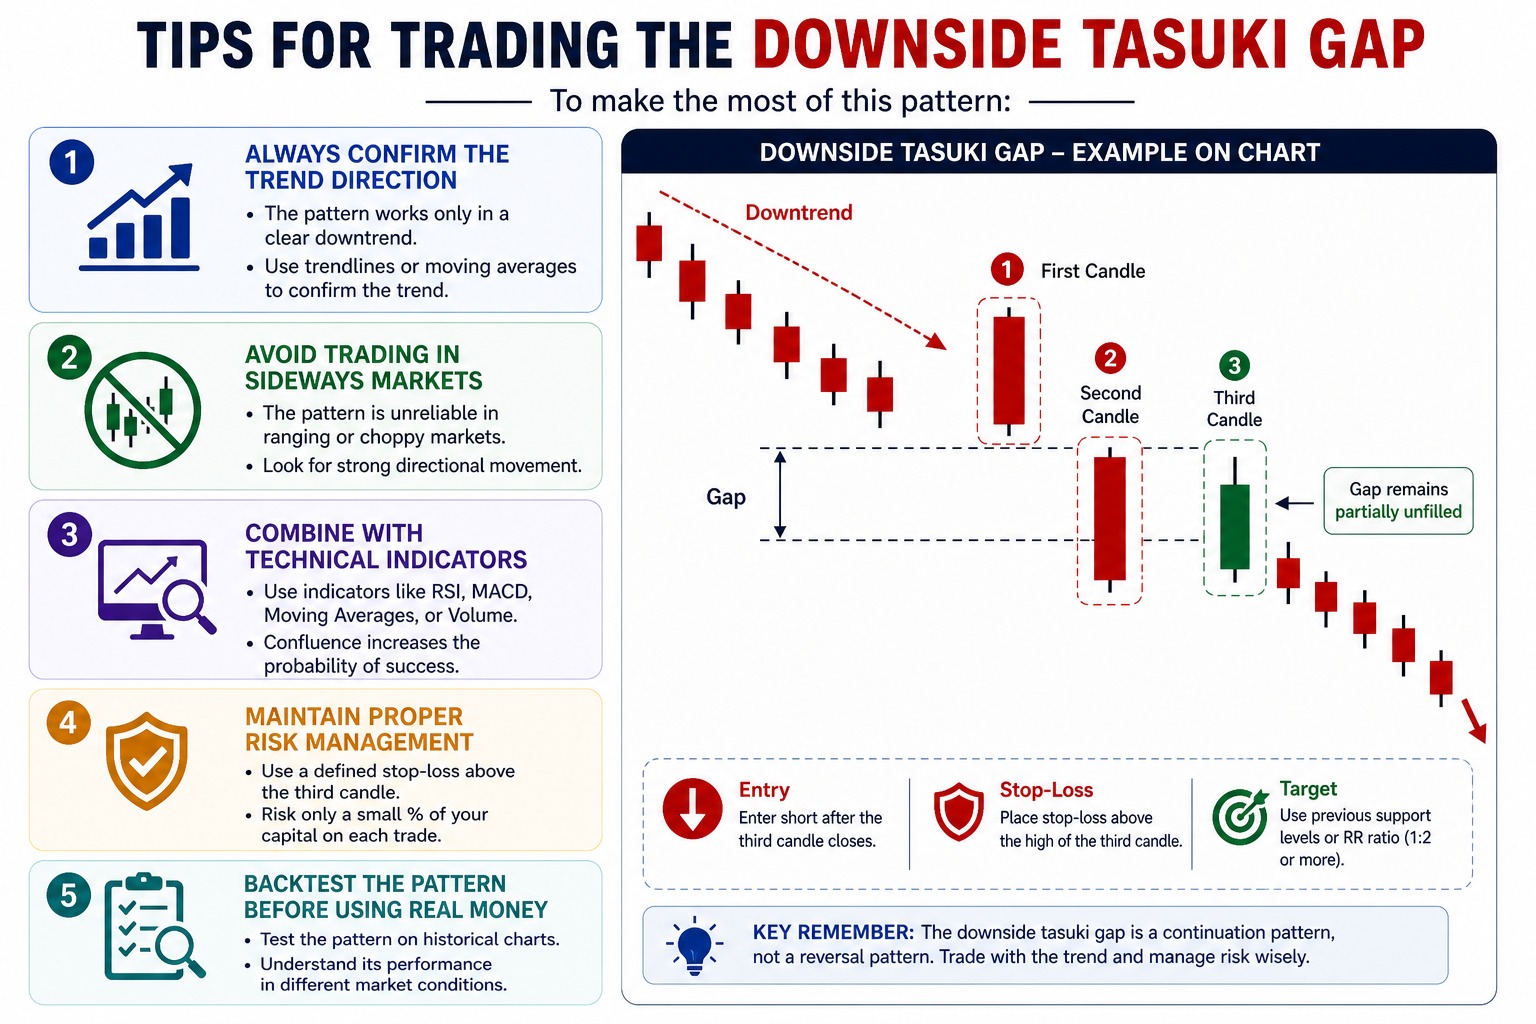
To make the most of this pattern:
- Always confirm the trend direction
- Avoid trading in sideways markets
- Combine with technical indicators
- Maintain proper risk management
- Backtest the pattern before using real money
Common Mistakes to Avoid
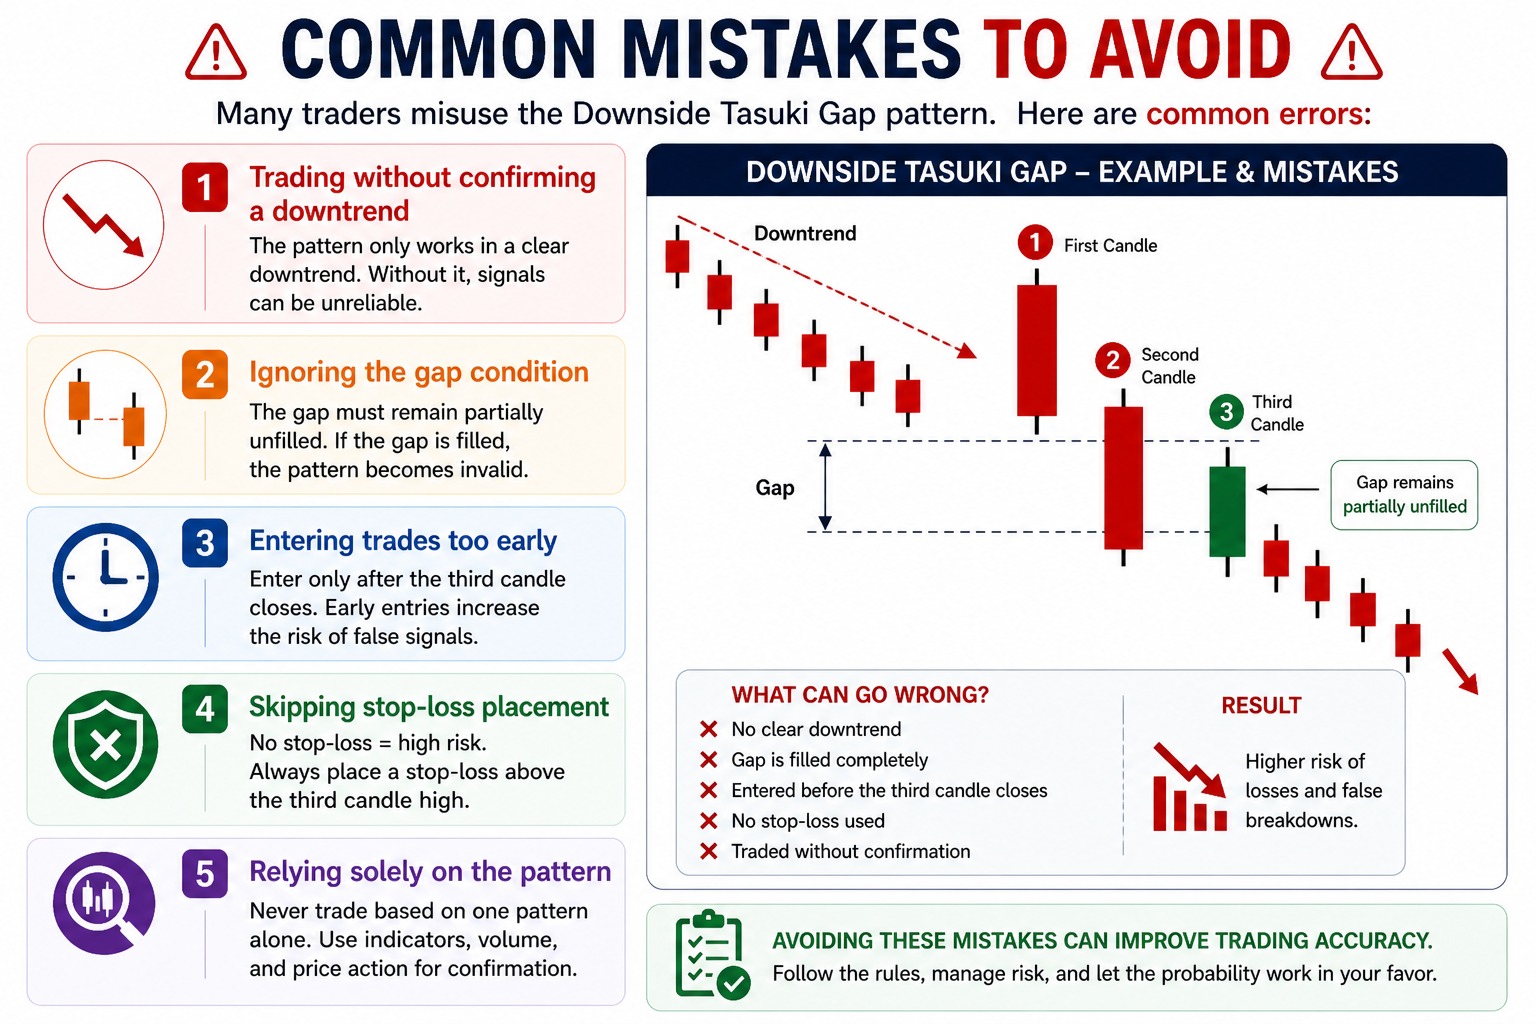
Many traders misuse this pattern. Here are common errors:
- Trading without confirming a downtrend
- Ignoring the gap condition
- Entering trades too early
- Skipping stop-loss placement
- Relying solely on the pattern
Avoiding these mistakes can improve trading accuracy.
Conclusion
The downside tasuki gap is a valuable continuation pattern that helps traders identify ongoing bearish trends. By understanding the downside tasuki gap meaning and applying a structured downside tasuki gap strategy, traders can make more informed decisions.
However, it’s equally important to recognize the downside of tasuki gap limitations and use the pattern alongside other technical tools. When used correctly, it can be a powerful addition to a trader’s strategy—but like all indicators, it works best with discipline, confirmation, and proper risk management.
CONTACT US
Website : https://mbear.in/
Phone : +91 984502 7284
Mail : [email protected]
Address- #331, 2nd floor, Siddaiah Puranik Road, 3rd stage, 4th block, Basaveshwara Nagar, next to Yes Bank, Bengaluru, Karnataka- 56007